Internet Explorer 8 includes tools that Web developers need to efficiently debug
their sites directly in Internet Explorer. Developers can debug a site's HTML, CSS, and Microsoft® JScript from within Internet Explorer 8 (with developer tools), rather than switch between Internet Explorer and a separate development environment.
This article give a brief review why and how to use IE 8 developer tools.
Why use Developer tools?
You may want to quickly debug JScript, investigate a behavior specific to Internet Explorer, or test a new design or try solutions to a problem. In these and similar scenarios, Internet Explorer 8 includes easy-to-use Developer tools that have a few important characteristics:
- Integrated and simple to use - An instance of the Developer Tools comes with every installation of Internet Explorer 8. This enables debugging on any machine running Internet Explorer 8. In addition, the tools only load when needed to limit the impact of the tools on browser performance.
- Provide a visual interface to the platform - Instead of reverse engineering how your site works or modifying your site to output debug information, the Developer Tools let you look into Internet Explorer to view its representation of your site.
- Enable fast experimentation - When prototyping a new design or testing fixes in previous versions of Internet Explorer, you likely edit your source, save it, refresh your page in the browser, and repeat. The Internet Explorer 8 Developer Tools streamline this scenario by letting you edit your site within the browser and see changes take effect immediately.
- Optimize application performance - Identifying and fixing performance issues is usually an iterative approach done by focusing on one scenario at a time. With the Internet Explorer 8 Developer Tools script Profiler, you can collect statistics like execution time and number of times a JScript function was called as you test your application and use the profile report to quickly identify and fix performance bottlenecks.
How to use Developer Tools
To begin using developer tools, click the Developer Tools icon in the Tools drop down menu (or press SHIFT+F12):

The Developer Tools have three modes: HTML, CSS, and Script. Each mode provides tools for inspecting and debugging that content type.
HTML mode
HTML mode lets you explore the DOM tree exactly as it exists in Internet Explorer. The DOM tree lists elements as well as attributes and values.
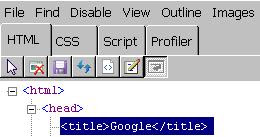
For example we can go on www.google.com. Open Developer Tools and choose HTML tab.

Clicking an attribute or value makes it editable. If we click on title and change "Google" to "My Google Test" after removing focus from the editable value commits the change back to Internet Explorer and causes the page to update immediately.
Now title bar text is "My Google Test".

To visual select an element, enable Select Element by Click (first icon (arrow) or CRTL + b) and click any area of the site.
In example below "Select Element by Click" is clicked (1) and then is clicked on Advanced Search (2). In the end Text is edited to "Advanced Search Test" (3).

The Layout tab displays a visual representation of the box model and corresponding values for the selected element:

- The offset values display the distance to the parent object as defined by the offsetLeft and offsetTop properties
- The margin, border, and padding values display corresponding values specified by the author
- The innermost values are the element's height and width as defined by the offsetHeight and offsetWidth properties<(li>
The Style tab and Trace Style tab are very similar. Style tab lists all style rules that apply to the selected element in cascade order, with overruled styles struck through while in Trace Style styles are grouped by property instead of by rule. This makes the computed value of a property immediately visible. So we can say that Style view is inverse of Trace Style.
Example of Style view:

Example of Trace Style view on same HTML element:

CSS mode
In CSS mode, choose any CSS file used on the site to view an expandable tree view of all style rules in the file.
Example of JScript debugging with developer tools in IE 8
To see how to debug java script code in IE 8 you can go on test page with IE 8 and follow instructions :
- Turn on Developer tools (press F12)
- Click on Script tab
- Insert breakpoint on line 10
- Click "Start Debugging"
- To debug currently running script sessions that started with script debugging disabled, Internet Explorer must first refresh the page. Before refreshing, Internet Explorer displays a dialog box asking if users want to refresh or cancel.
- Click on button "Call function".
- Button Call function calling jscript function "calculate"
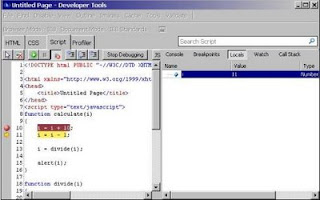
- Now you are in debug mode. Click on tab Locals and you will see that value of variable is 1.
- Click on icon Step Into (F11)
to execute current line of jscript code and go on next
- Step into - Executes the next line of script and pauses, even if the next line is inside a new method. (Keyboard shortcut: F11)
- Step over - Executes the next line of script, continues until the next line of script in the current method, and then pauses. (Keyboard shortcut: F8)
- Step Out - Continues executing script until the next line in the method that called the current method. (Keyboard shortcut: SHIFT+F11)
- Continue - Continue running script without pausing until hitting another breakpoint (if any are set).(Keyboard shortcut: F5)
- Break All: - Pause execution before the next script statement to be executed
- Now you are at line 11. Take a look at Locals and you will see that i has value 11 (this is because line 10 : i = i + 10, so 11 = 1 + 10)
- The Locals tab within Script mode displays the name, value, and type of all variables available in the current execution scope. So with help of Locals tab you can track values of variables.
- Go to line 11, move mouse pointer to i, right click and choose "Add Watch". You can see that variable "i" is added in Watch tab.
- Use the Locals pane to view local variables and the Watch pane to monitor a custom list of variables. You can add variables to this list by right-clicking in the source and clicking Add Watch or typing the variable name in the Watch pane.
- Click on Call Stack pane and you should see that "JScript - onclick function" fired "calculate" function.
- After two more steps (click "Step Into" two times), function "calculate" called function "divide", we are at line 20 inside function "divide". Call Stack pane provides a list of execution contexts : divide is called by calculate which is called by "JScript - onclick function"
- To jump to any stack item, double-click the item. The debugger will bring that method into view in the Primary Content Pane. On the picture calculate function is clicked in Call Stack pane (call to divide function line 20 is highlighted in green color)


Profiler
The Profiler gives you data on the amount of time spent in each of your site's JScript methods. Since you can start and stop the JScript Profiler at any time during application execution, you can collect multiple profile data for the specific scenario that interests you.
Let's see on example:
- Go on test page with IE 8, choose profiler pane and click on button "Start profiling"
- On test web page click button "Call function"
- Clik Ok to close Message Box
- Click Stop Profiling in Profiler Pane

Now we have list of functions and their spent of time. Function divide is very simple so it takes 0 ms. Function calculate takes time needed to click Ok on message box. Even onclick is event that fired function calculate. Maybe this is not best example but it is good enough to understand main concept of Profiler.

The profile reports can be viewed with either the Functions or the Call Tree view, which can be selected from the Current View drop-down list.
- The Functions view lists all the functions used
- The Call Tree view provides the hierarchy of calls
Related articles on this blog:
New features in Internet Explorer 8
Related articles from other sources:
Discovering Internet Explorer 8 Developer Tools on MSDN


2 comments:
Who knows where to download XRumer 5.0 Palladium?
Help, please. All recommend this program to effectively advertise on the Internet, this is the best program!
Great information about Internet Explorer. I like your post so much. Internet Explorer is great browser for web surfing and many more. It is popular in many counties. If you want Internet Explorer Toolbar Development then visit our website.
Post a Comment